Decoding FSK
Something I’ve been playing with lately is software defined radio with GNURadio. I’m not good at it yet, but I’ve managed to decode the signals from a couple of things.
This is my step-by-step for how I decoded data from a boiler thermostat. I’m not saying it’s the best way, or even a good way. But it’s what got me there.
0. Find the frequency
Often this is written on the device itself. Other times it’s in the manual. If not, then more research is needed, such as by trying to find the manufacturer on fcc.gov or similar.
In this case it was easy. The manual said “868 MHz”, which is in the SRD860 band.
1. Capture some data
When I poked at the controls of the thermostat, saying “please make the room 25 degrees”, the thermostat must send this data to the boiler. I could hear the boiler start up and shut down, so there must be something sent between me pressing the buttons and I heard the results.
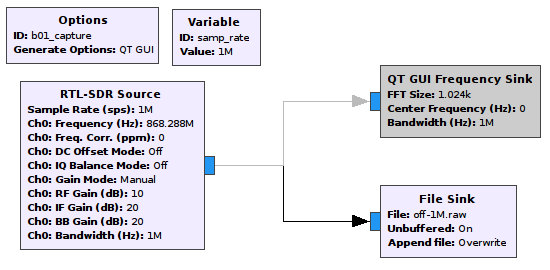
I started by centering around 868.5 Mhz with 1Msps. The minimum for the RTL-SDR is 900ksps, so even if you wanted to see less than 1MHz you need to capture more first, and then downsample later.
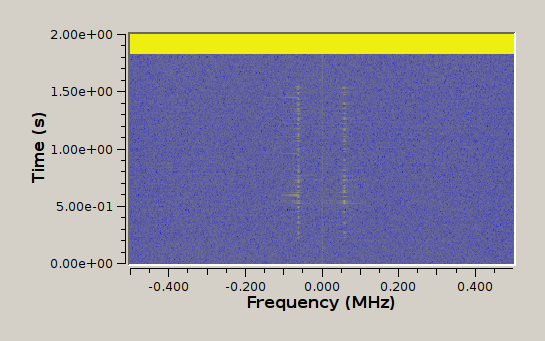
A waterfall showed action around 868.288 MHz, that when slowed down
became obvious 2FSK.
I started a new capture at 868.288Mhz at 1Msps of both “boiler goes on” and “boiler goes off”, and saved to file.
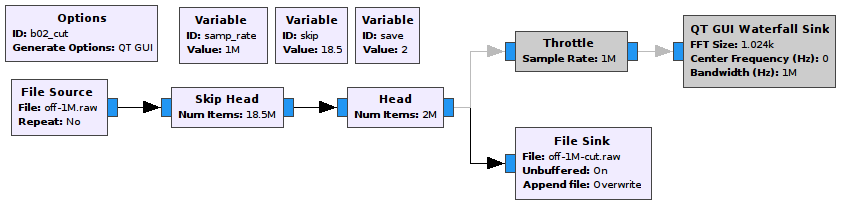
2. Cut away everything before and after the burst
Tweak “skip” and “save” variables (given in seconds) to get a smaller file that can be played with without needing to wait. Keep a bit of buffer on both sides though.
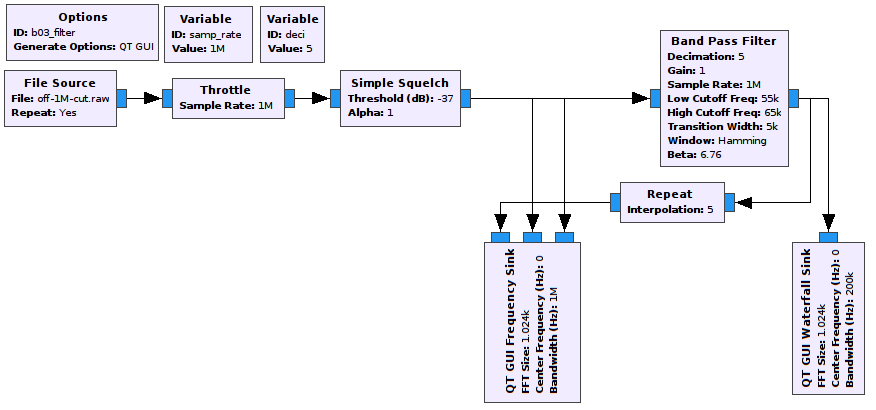
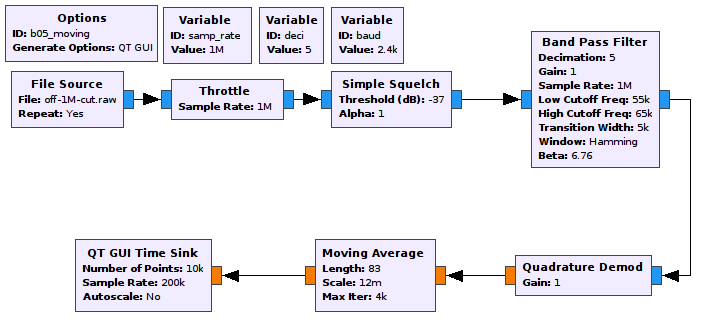
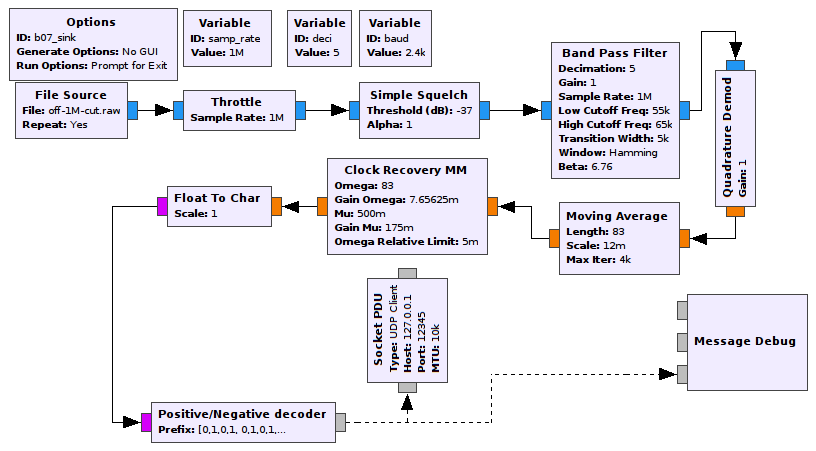
3. Filter the signal
An easy way to clean up the signal is to squelsh away the noise, and then band pass only the regions where there should be signal.
This is very likely not the best way to get the best range, but it does make it easy to work with the signal visually. And decoding a strong signal can be a first step to later tweaking to be able to receive weaker signals.
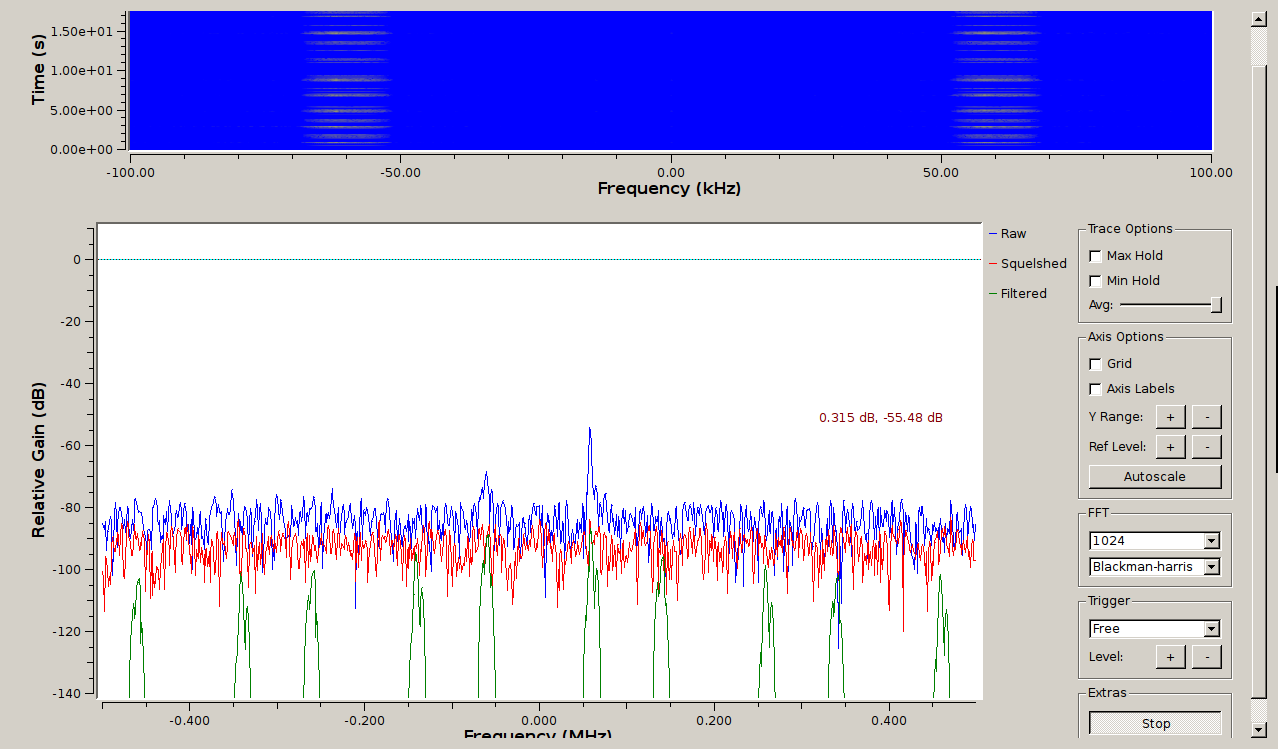
All inputs to a Frequency Sink must have the same sample rate, so compensate for the decimation by repeating the signal.
Because the signal coming out of the band pass filter is not still the original sample rate, it’ll create lots of aliasing in the graph. That’s fine. We’ll be working with the decimated sample rate anyway.
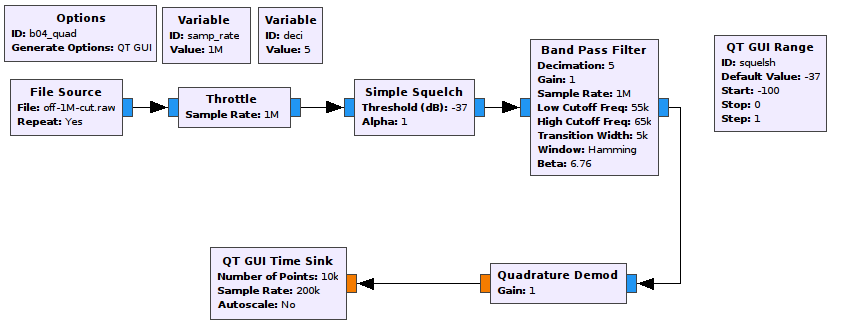
4. Quadrature demod
Quadrature demod is a magic box that turns water into wine, and 2FSK into floats. The output is essentially “>0 means the higher frequency was active, <0 means the lower frequency was active”, and the value shows how much more active that frequency was.
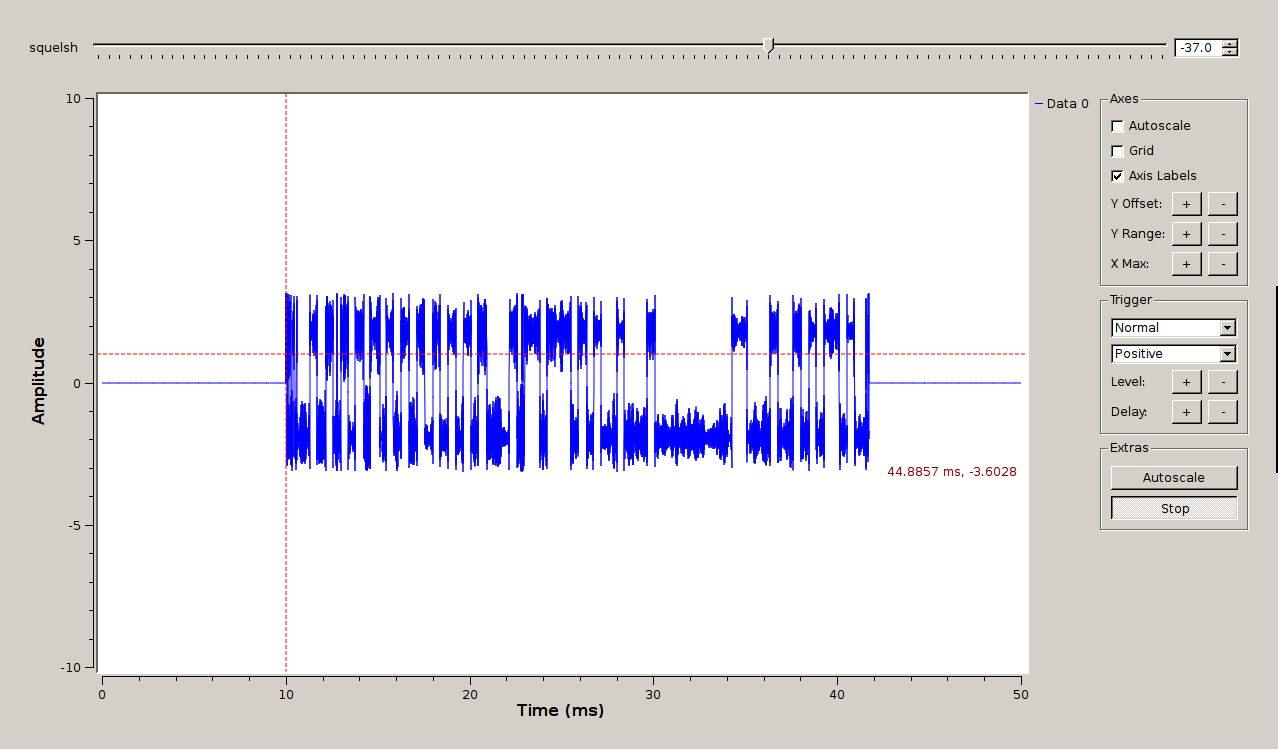
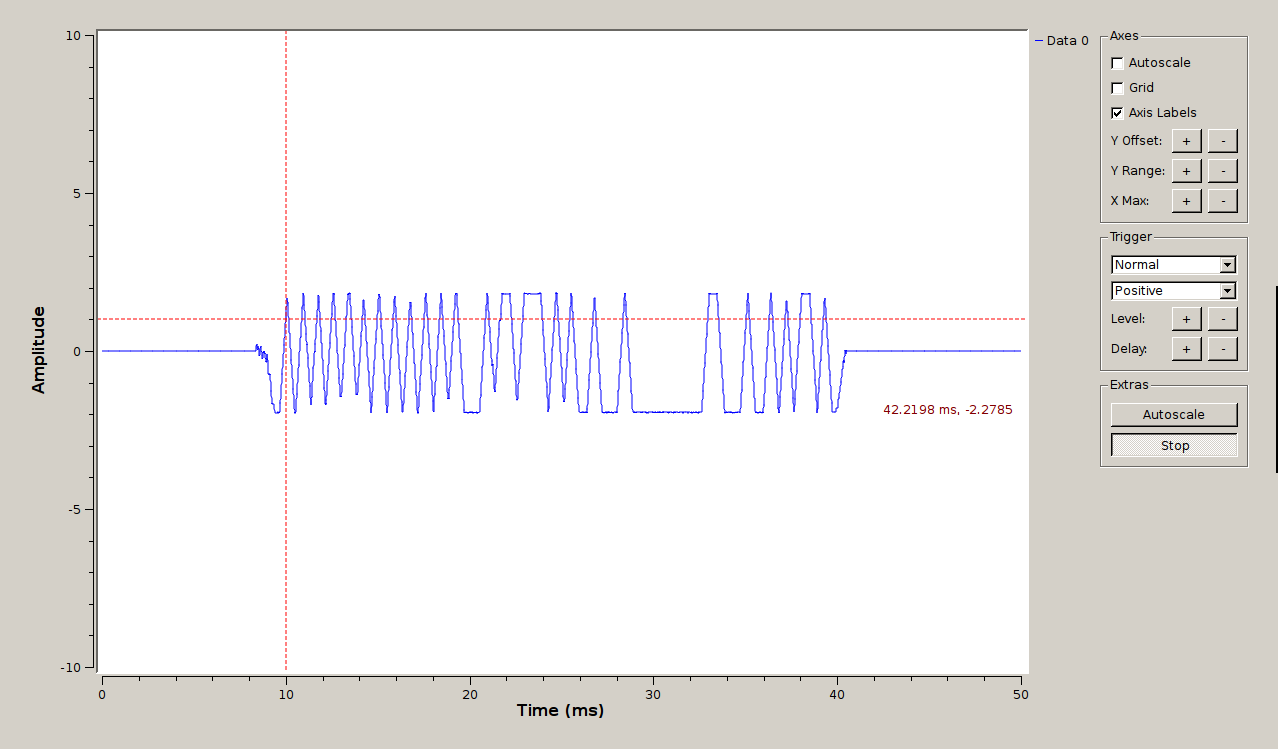
5. Moving average
What came out of quadrature demod was a square wave. The input to clock recovery needs to have peaks, or it won’t be able to center a bit around that peak. If the peak is flat then it won’t be able to adjust closer to the center of that peak.
A moving average will do this nicely. The number of samples to average is the width, in samples, of a peak.
The output is now a very nice and obvious bit pattern.
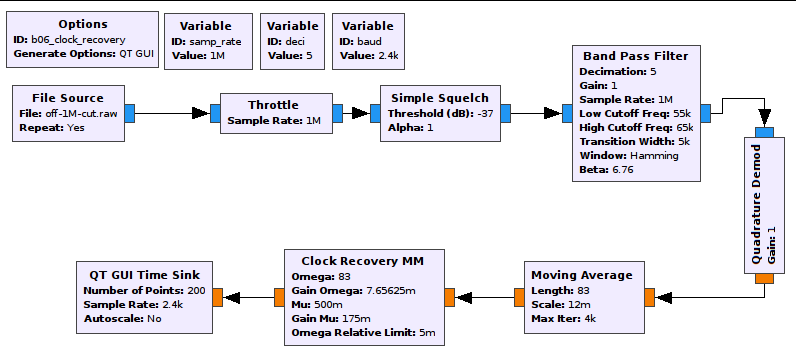
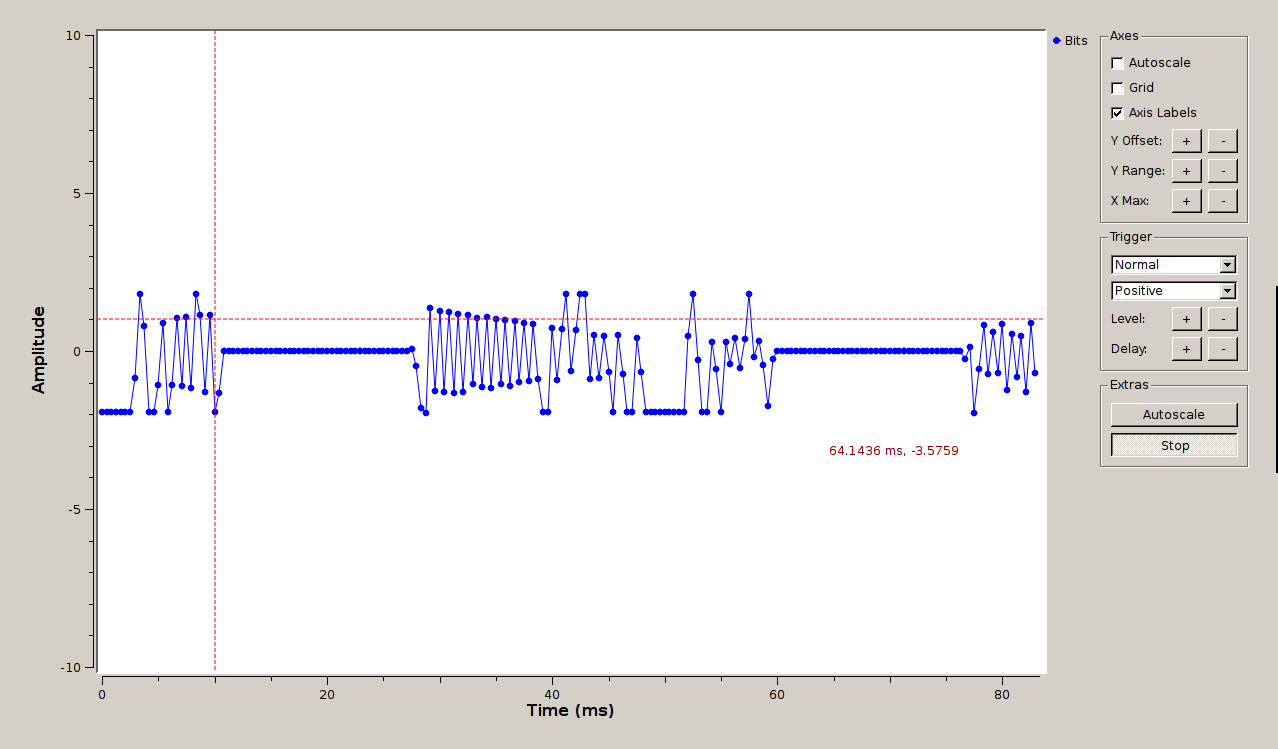
6. Clock recovery
Clock recovery takes a stream of data and picks out the “bits”, giving one output sample per bit. This is much better explained in the Guided tutorial PSK demodulation.
These output bits don’t actually look that good. I found that I get reliable output in the end, but clock recovery is clearly the weak part of my project.
7. Packets, assemble!
We now have a stream of bits, surrounded on both sides by zeroes. Turns out there’s no good standard block to turn this into packets. There’s “Tagged Stream to PDU”, but it wants the packet length.
So I had to write my own block. Because this block will be running at the bit rate of 2400sps and not the original sample rate of 1Msps or even the post-filter sample rate of 200ksps, I thought it would be fine to write it in Python. I have another block decoder for OOK designed to run at higher sample rates, and there the performance benefits of using C++ really mattered.
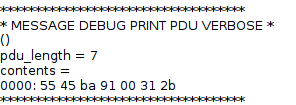
The block treats >0 as “one”, <0 as “zero”, and 0 as “end of packet”. At end of packets it tries to find the packet preamble, and if found will emit a PDU.
As expected, the packet for “on” and the packet for “off” are static, and they differ by one bit.
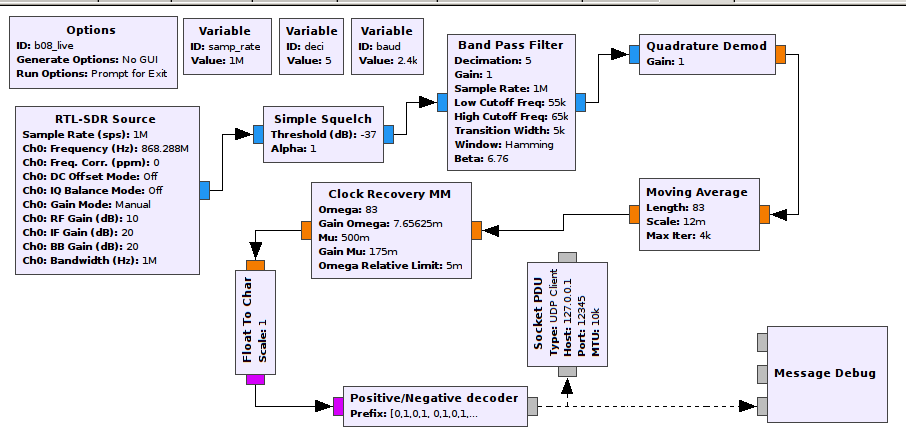
8. Ship it!
This is the same as step 7, except capturing data live. The flow graph is simple and fast enough to run on a Raspberry Pi 3.
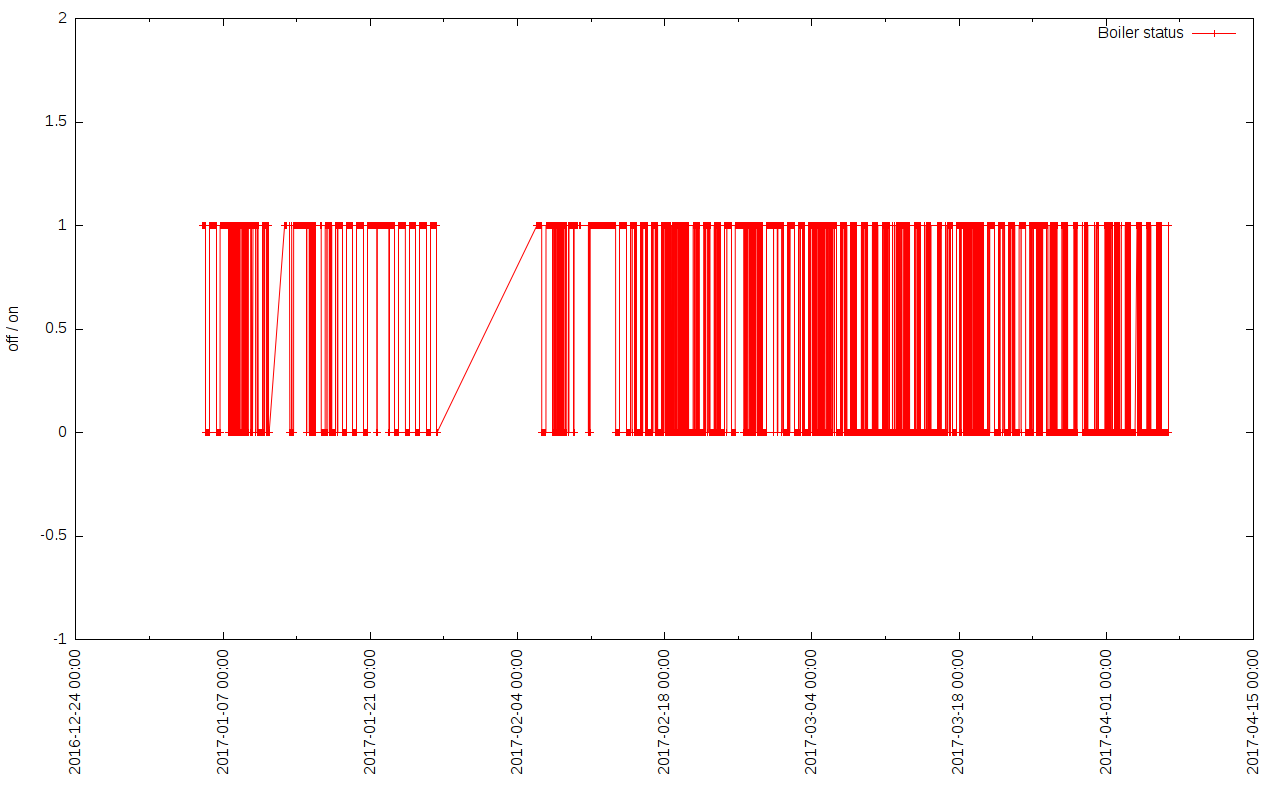
9. Data over time
After setting this up to log indefinitely I saw that the thermostat sends a command to the boiler once every 10 minutes in addition to when I triggered it with buttons. Presumably if the thermostat dies the boiler will automatically shut down after missed commands, so these transmissions every 10 minutes serve as keep-alive.